
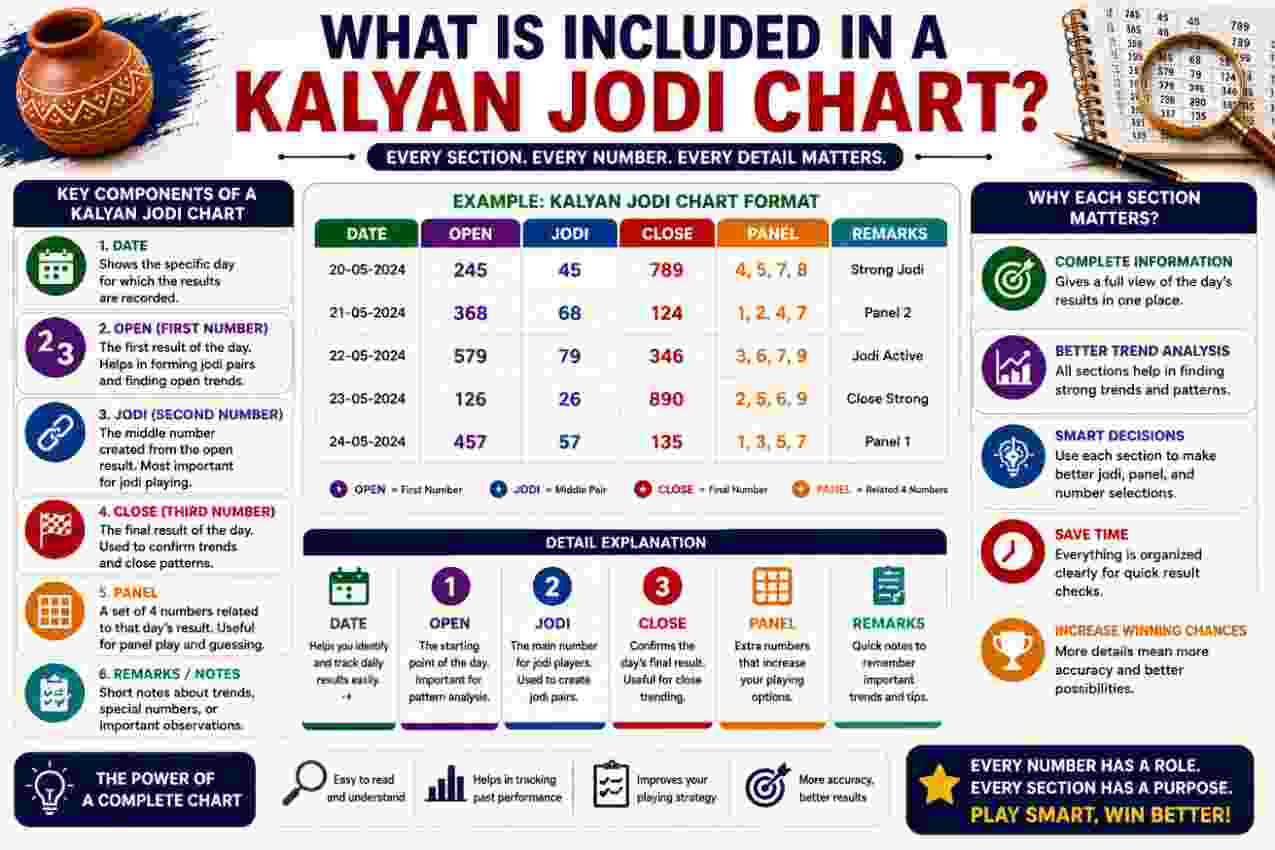
A Kalyan Jodi Chart presents past Kalyan market results in an organized format. It commonly displays dates, open digits, close digits, panel combinations, and the resulting two-digit Jodi. Readers use the chart to locate previous outcomes, check entries across specific periods, and identify how individual numbers form complete results. Although layouts can differ, the underlying information usually follows a consistent structure. Knowing what each column, digit, and symbol represents helps readers interpret the record correctly. A chart documents declared outcomes; it does not guarantee or accurately predict any future result.
Core Purpose of a Kalyan Jodi Chart
A Kalyan Jodi Chart works as a historical record rather than a simple list of random numbers. It arranges declared outcomes by date, allowing readers to follow Kalyan market activity across days, weeks, months, or years.
Moreover, the chart connects several result components within one entry. A reader may see the open panel, open digit, close panel, close digit, and final pair together. Consequently, the format makes detailed result checking faster and more convenient.
A Structured Record of Past Results
Each completed row generally represents one market date. The row connects the date with the corresponding result components, creating a chronological archive.
Depending on the chart design, readers may find the newest result at the top or bottom. Therefore, checking the date order before reading any entry remains essential.
Historical organization helps readers:
- Find the result declared on a particular date
- Compare results across consecutive market days
- Check whether an old result was recorded correctly
- Review weekly or monthly entries
- Separate confirmed records from informal number claims
A Link Between Panels, Digits, and Jodis
The final Jodi does not appear in isolation. Instead, it comes from the open and close result process.
For example, the chart may show a three-digit open panel whose total produces an open digit. Similarly, a close panel produces the close digit. The chart then places those two single digits together to create the final Jodi.
This connection allows readers to trace the full result instead of viewing only the final pair.
Date and Day Information
The date forms one of the most important elements in a Kalyan Jodi Chart. Without a clear date, readers cannot connect a numerical result with the correct market session.
Most charts arrange dates chronologically. However, some use weekly blocks, monthly sections, or calendar-style layouts.
Calendar Date
A standard entry may display the complete calendar date in day-month-year or month-day-year format. Other charts may show only the day and month when the year already appears in the section heading.
Readers should confirm the format before interpreting an entry. For instance, 04/08 can mean 4 August or 8 April, depending on the chosen convention.
A clearly written date helps distinguish:
- Results from different months
- Entries with similar numerical combinations
- Current records from archived data
- Market holidays from regular operating days
Day of the Week
Some charts include weekday labels such as Monday, Tuesday, Wednesday, Thursday, Friday, or Saturday. Kalyan market schedules traditionally follow defined operating days, although publishers may structure archives differently.
Additionally, weekday labels make long records easier to scan. A reader searching for a previous Wednesday result can locate the relevant column or row without checking every date individually.
Closed or Unavailable Dates
Not every calendar date contains a declared result. Market closures, holidays, schedule changes, or unavailable records may leave blank spaces.
Charts often represent these dates through:
- A dash
- An empty cell
- A closure label
- An asterisk
- A short abbreviation
- A shaded or differently colored box
Therefore, a blank cell should not automatically be treated as a zero or missing digit. The chart legend or nearby note may explain its meaning.
Open Panel Details
The open panel commonly appears near the beginning of a result entry. It contains three digits associated with the opening stage of the market result.
Although the final pair attracts the most attention, panel details provide the numerical basis behind every single digit.
Three-Digit Open Panel
An open panel usually contains a three-digit combination, such as 128, 349, or 570. The chart may display the digits together or separate them with spaces.
Readers add the three digits and use the last digit of the total as the open digit. For example, the digits in 128 produce a total of 11. Consequently, the last digit, 1, becomes the open digit.
Another example uses 570:
- 5 + 7 + 0 = 12
- The last digit of 12 is 2
- Therefore, the open digit is 2
This calculation shows how the panel connects with the first digit of the Jodi.
Panel Ordering
Panel numbers follow established numerical presentation practices. However, different chart layouts may use compact strings, separated digits, or specially formatted cells.
The reader should preserve the displayed order when recording a panel. Although addition produces the same total regardless of order, the exact three-digit panel remains a distinct recorded result.
For that reason, 128 and 218 should not be treated as identical entries when checking historical panel records.
Open Digit Information
The open digit is a single number derived from the open panel total. It becomes the first digit of the two-digit Jodi.
A Kalyan Jodi Chart may display this number in a separate column, highlight it with a color, or position it between the open and close panels.
How the Open Digit Is Calculated
To calculate the open digit, readers add all three numbers in the open panel. If the total has two digits, only its final digit counts.
Consider these examples:
- Panel 137: 1 + 3 + 7 = 11, so the open digit is 1
- Panel 460: 4 + 6 + 0 = 10, so the open digit is 0
- Panel 589: 5 + 8 + 9 = 22, so the open digit is 2
- Panel 246: 2 + 4 + 6 = 12, so the open digit is 2
Thus, the displayed single number should match the final digit of the panel total.
Its Position Within the Jodi
The open digit always occupies the first position in the recorded pair. If the open digit is 3 and the close digit is 7, the final Jodi becomes 37.
The positions should not be reversed. In contrast, 73 represents a different pair because it starts with 7 and ends with 3.
Close Panel Details
The close panel records the three-digit combination associated with the closing stage. Its digits produce the close digit through the same addition method used for the open side.
Charts commonly place the close panel after the final Jodi or close digit. Nevertheless, the exact sequence depends on the layout.
Three-Digit Close Panel
Suppose the close panel is 269. Adding 2, 6, and 9 produces 17. Therefore, the close digit is 7.
Similarly, a close panel of 145 produces a total of 10, making the close digit 0.
The panel offers valuable verification because readers can independently calculate the single digit and compare it with the displayed result.
Relationship With the Close Digit
The close panel produces only the second digit of the Jodi. It does not alter the previously declared open digit.
For example:
- Open panel: 237
- Open total: 12
- Open digit: 2
- Close panel: 569
- Close total: 20
- Close digit: 0
- Final Jodi: 20
Accordingly, every complete result links two panels, two single digits, and one pair.
The Final Two-Digit Jodi
The final Jodi forms the central element of a Kalyan Jodi Chart. It combines the open digit and close digit in their declared order.
The first position represents the open side, while the second position represents the close side.
How the Pair Is Formed
If an open panel produces 4 and a close panel produces 8, the Jodi becomes 48. Likewise, open digit 0 and close digit 6 create 06.
Leading zeroes matter. Therefore, 06 should remain written as a two-digit pair rather than 6. The complete notation distinguishes it from a single-digit result.
Possible pairs run from 00 through 99, creating 100 two-digit combinations. Each position can contain any digit from 0 to 9.
Why Digit Order Matters
A pair retains meaning through its sequence. For example, 24 and 42 contain the same two digits but record different open and close outcomes.
The distinction becomes clear when the components appear separately:
- Jodi 24: open digit 2 and close digit 4
- Jodi 42: open digit 4 and close digit 2
Consequently, readers should copy pairs exactly as displayed and preserve any leading zero.
Common Kalyan Jodi Chart Layouts
Publishers organize chart information in several ways. While the visual arrangement may change, reliable layouts keep dates and corresponding results clearly connected.
Readers should first identify the structure, date direction, and column labels before checking any entry.
Daily Row Layout
In a daily row format, each horizontal line contains one date and its complete result. A typical sequence may include:
- Date
- Open panel
- Open digit
- Jodi
- Close digit
- Close panel
This arrangement provides detailed information in one line. Moreover, it suits readers who need to verify every component of a declared result.
Weekly Grid Layout
A weekly grid places weekdays across columns and date ranges down the side. Each cell may contain only the Jodi or the complete panel-to-panel result.
Weekly grids make repeated weekday comparisons convenient. However, readers must carefully match the correct week with the correct column.
Monthly Archive Layout
Monthly archives group all available entries beneath a month and year heading. They may use daily rows or calendar boxes.
This layout supports faster historical searches because readers can move directly to the required month. Additionally, clear monthly separation reduces confusion between identical day numbers from different periods.
Yearly Record Layout
A yearly chart combines several monthly sections into one long archive. Some versions display only Jodis to conserve space, while others retain panels and single digits.
Because yearly records contain many entries, visible month labels, consistent spacing, and readable date formats become especially important.
Symbols, Colors, and Special Markings
Many charts use visual signals to make particular entries easier to notice. These signals may carry useful formatting meaning, but they do not change the numerical result itself.
Since publishers choose their own styles, readers should avoid assuming that every color or symbol has a universal definition.
Color Highlights
Colors may separate open and close information, distinguish weekly sections, or emphasize a newly updated result. For example, one color might mark Jodis while another identifies panels.
However, colored text does not automatically indicate a special outcome. The meaning depends entirely on the chart’s formatting system.
Dashes, Stars, and Blank Cells
A dash often indicates that no result appears for that date. Similarly, a star may identify a closure, pending entry, correction, or special note.
Blank cells can represent several conditions:
- Market closed
- Result not available
- Entry awaiting an update
- Data omitted from the archive
- No scheduled session
Therefore, readers should seek an accompanying legend before interpreting a symbol.
Corrections and Updated Entries
Occasionally, a chart may correct a typing error or replace an incomplete result. Publishers might highlight the revised cell, add an update marker, or display a note beside the date.
When two versions conflict, the most recently verified record may offer greater accuracy. Nevertheless, the numerical relationship between panels and digits should still pass basic calculation checks.
How to Read a Complete Entry
Reading a Kalyan Jodi Chart accurately requires a consistent sequence. Starting with the date and then tracing each numerical component reduces mistakes.
A complete entry should show a logical connection from the open panel to the close panel.
Step-by-Step Reading Method
Use the following process:
- Locate the required date.
- Confirm the month and year.
- Read the open panel exactly as displayed.
- Add its three digits.
- Check the open digit against the total’s final digit.
- Read the first digit of the Jodi.
- Confirm that it matches the open digit.
- Read the close panel.
- Add its three digits.
- Compare the final digit with the close digit.
- Confirm that the close digit matches the Jodi’s second position.
This method checks both the displayed record and its internal numerical consistency.
Illustrative Entry
Consider an entry containing an open panel of 346 and a close panel of 128.
The open calculation becomes 3 + 4 + 6 = 13, producing open digit 3. Meanwhile, the close calculation becomes 1 + 2 + 8 = 11, producing close digit 1. Therefore, the final Jodi is 31.
The entry may appear as:
- Open panel: 346
- Open digit: 3
- Jodi: 31
- Close digit: 1
- Close panel: 128
Differences Between Jodi and Panel Records
A Jodi chart focuses mainly on the two-digit pair, whereas a panel record emphasizes three-digit combinations. Some layouts combine both, which can make the distinction less obvious.
Recognizing the difference helps readers select the appropriate data without confusing one result type with another.
Jodi-Focused Information
A simplified Kalyan Jodi Chart may include only dates and two-digit results. This compact format suits quick historical checks but does not reveal the panels behind each pair.
For example, it may show:
- Monday: 26
- Tuesday: 71
- Wednesday: 04
Readers can identify the declared pairs, but they cannot verify which three-digit panels generated the individual digits.
Panel-Focused Information
A panel-focused record lists three-digit open and close combinations. It may also show the resulting single digits and Jodi.
Because multiple panels can produce the same final digit, panel information provides greater detail. For example, 128, 137, and 236 all produce a final digit of 1 after addition.
Combined Information
A combined chart offers the fullest historical entry. It allows readers to see the date, both panels, both single digits, and the completed Jodi together.
Consequently, this format supports stronger result verification and reduces the need to consult separate records.
Historical Patterns Visible in the Chart
A chart can reveal repeated numbers, gaps, and distribution across a selected period. However, historical repetition does not establish a dependable future sequence.
Every recorded entry describes a past declaration. Therefore, readers should separate factual recordkeeping from speculative interpretation.
Repeated Jodis
The same pair may appear more than once across a weekly, monthly, or yearly record. Repetition simply shows that identical open and close digits occurred on different dates.
It does not prove that the pair follows a fixed cycle. Similarly, a long absence does not guarantee that a particular Jodi will appear next.
Single-Digit Frequency
Readers may count how often each open or close digit appears. Such counting creates a frequency summary for a defined historical period.
Nevertheless, frequency only describes the selected data. Changing the date range can produce a different distribution.
Open-to-Close Relationships
The chart also permits comparison between open and close digits. Readers may notice doubles such as 00, 11, 22, or 77, alongside mixed pairs such as 28 or 63.
These categories help organize records. However, they should not be treated as certainty-based forecasting tools.
Accuracy Checks for Chart Readers
Numerical accuracy matters because a single typing error can change a panel, digit, or pair. Basic checks help readers identify inconsistent entries.
Furthermore, date verification prevents a correct result from being assigned to the wrong session.
Recalculate Panel Totals
Add each panel independently and compare the last digit with the displayed single digit. If the values do not match, the chart may contain a transcription error.
For instance, panel 247 totals 13 and should produce 3. A displayed digit of 4 would require rechecking.
Match Both Digits With the Pair
The first Jodi digit must match the open digit, while the second must match the close digit. If the separate digits show 5 and 9, the pair should read 59.
Leading zeroes deserve particular attention because software or spreadsheets may remove them automatically.
Confirm the Date Range
Before recording a result, confirm the date, month, year, and weekday when available. This step becomes especially important when several archive sections use similar layouts.
Additionally, check whether the chart runs in ascending or descending date order.
Responsible Use of Historical Information
A Kalyan Jodi Chart should function as an informational record of past results. It cannot provide certainty about future outcomes, regardless of visible repetition or perceived patterns.
Users should also consider applicable laws, age restrictions, and financial risks before participating in any number-based wagering activity.
Records Do Not Guarantee Predictions
Historical data may support sorting, counting, and comparison. Even so, it cannot turn an uncertain future result into a guaranteed outcome.
Claims of fixed numbers, assured pairs, or certain returns require caution. No chart can remove the financial risk associated with wagering.
Set Clear Financial Boundaries
People who choose to participate should never use money required for rent, food, education, medical care, debt payments, or household needs.
Moreover, chasing losses can increase financial harm. A fixed spending limit and a firm stopping point provide essential boundaries.
Check Local Rules
Laws governing wagering vary by location and may change. Consequently, users must verify whether a particular activity is permitted where they live.
Age requirements also apply. Minors should not participate in gambling or wagering activities.
Conclusion
A Kalyan Jodi Chart typically contains dates, open panels, open digits, close panels, close digits, and completed two-digit pairs. Detailed layouts connect every component, while compact versions may show only dates and Jodis. Accurate reading requires careful attention to digit order, panel totals, leading zeroes, date direction, and special symbols. Although archived records support checking and numerical comparison, they cannot guarantee future outcomes. Readers should treat every chart as historical information, verify questionable entries carefully, follow applicable laws, and maintain responsible financial limits whenever wagering-related decisions arise.
FAQs
What does a Kalyan Jodi Chart show?
It usually shows historical Kalyan results arranged by date. Depending on the layout, entries may include open panels, open digits, two-digit Jodis, close digits, and close panels. Some compact versions display only dates and pairs, while detailed versions show every numerical component connected with each declared result.
How is the final Jodi calculated?
The last digit of the open panel total forms the first Jodi digit. Similarly, the last digit of the close panel total forms the second digit. If the open side produces 4 and the close side produces 7, the completed two-digit Jodi becomes 47.
Why do some Jodis begin with zero?
Zero can result from an open panel whose digits total 10, 20, or another number ending in zero. Therefore, a result such as 04 represents a valid two-digit pair. Removing the leading zero changes its written format and can create confusion during historical result checks.
What does a blank space in the chart mean?
A blank space may indicate a market closure, unavailable result, pending update, holiday, or omitted record. Its meaning depends on the chart’s formatting rules. Readers should check nearby notes, symbols, or legends before deciding whether the empty cell represents missing information or a scheduled closure.
Can the same Jodi appear multiple times?
Yes. Since possible pairs range from 00 to 99, the same Jodi can appear on different dates. Repetition records a historical occurrence but does not establish a guaranteed cycle. Each entry should remain connected to its own date, open panel, and close panel when those details are available.
Does a Jodi chart predict future results?
No. A chart records results that have already been declared. Readers can use it to search dates, verify entries, calculate frequencies, or compare past outcomes. However, repeated digits, gaps, and visual patterns cannot guarantee a future result or remove the financial uncertainty associated with number-based wagering.