
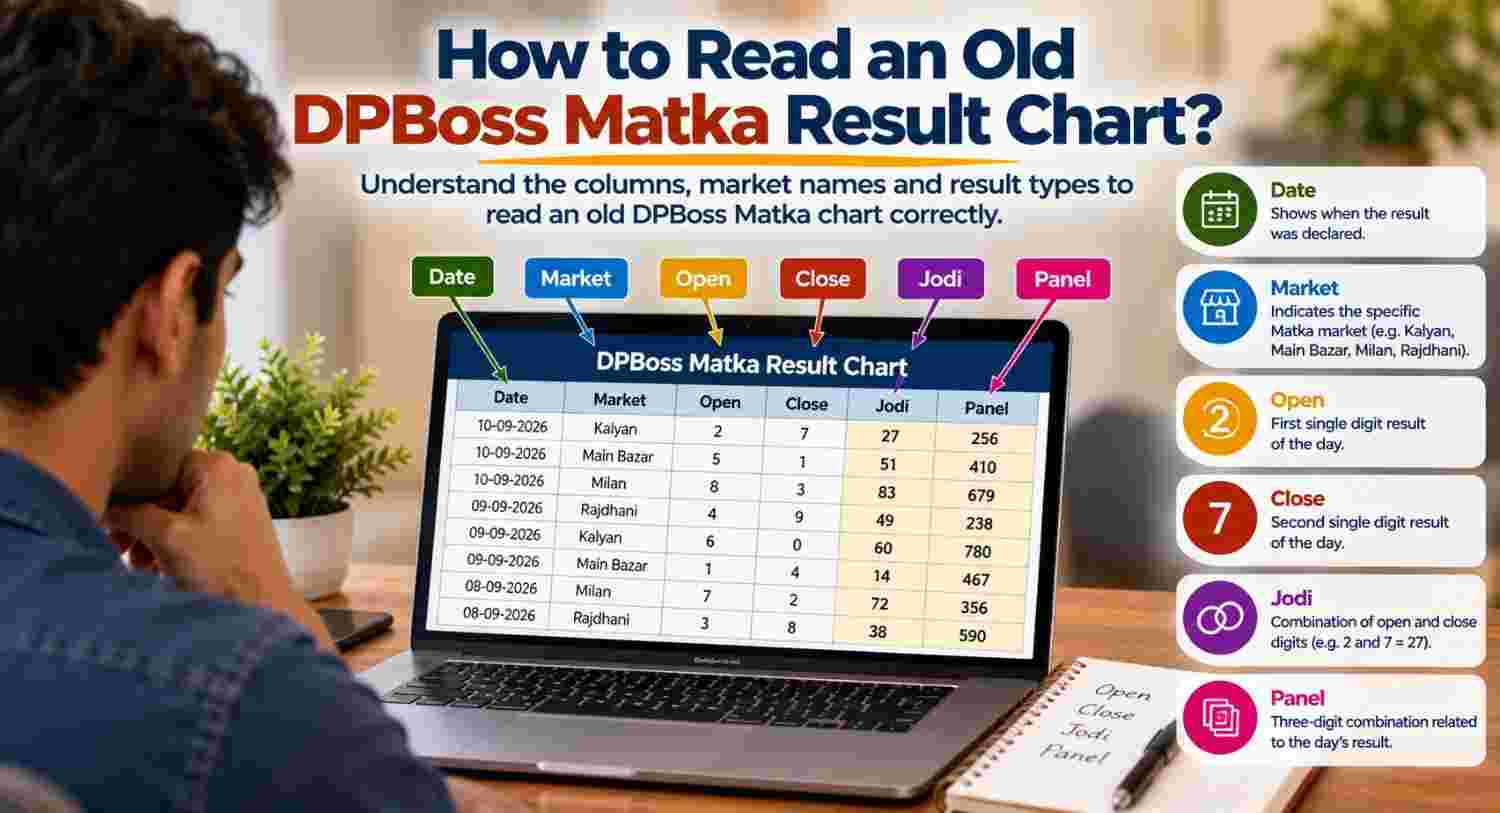
An old Matka result chart can be useful as a record, but only if its dates, labels, and result fields are read in context. Start by identifying the chart’s time span and category, then use its legend to interpret each entry. Check gaps, corrections, and formatting changes before treating the chart as complete. Historical entries document past information; they do not show what a future result will be.
What Does an Old Result Chart Record?
A historical chart arranges past result information so readers can refer to entries by date, category or another label supplied by the chart. Its exact purpose and layout depend on the source. Some charts may show a date beside one or more result fields; others may use abbreviations, symbols or a sequence that needs explanation.
A chart records only the information presented in that chart. It does not, by itself, prove that every entry is complete, that the labels have stayed consistent, or that a displayed value came from an independently checked record. Readers should treat it as a historical reference whose reliability depends on its source, scope and clarity.
Separate recorded information from interpretation
The displayed entry and the reader’s explanation are two different things. A date and value may appear together, but that does not show why the value occurred or what another value might be. Likewise, a sequence of past entries can look patterned without demonstrating a meaningful connection.
Read each chart as a collection of past records. Avoid turning an observation about the past into a claim about the future. This distinction matters even when a chart looks detailed or contains many dates.
Start With the Chart’s Scope and Date Range
Before reading individual cells, check what the chart covers. Its heading, labels, notes or surrounding context may identify a market, category, time period or result type. Do not infer missing scope from a familiar layout. If the chart does not clearly identify what its rows represent, mark that uncertainty before using it.
The displayed date range also needs careful attention. A chart may show a full year, a selected period or only a portion of a longer record. Look for the first and last dates, any month or year headings, and whether dates run in ascending or descending order. A page title alone may not establish the exact coverage.
Check date labels and sequence
Dates can appear in different formats. A chart might show day, month and year, or it might omit part of the date because a heading supplies the month or year. Read the complete label before assigning a date to an entry.
Check whether the sequence advances one day at a time, groups dates by month, or follows another stated arrangement. Do not assume that a missing date means no result was recorded. It could reflect an omitted row, a chart boundary, a formatting issue or an unexplained gap. The chart itself may not reveal which explanation applies.
Identify Result Fields Before Reading Values
A chart may divide entries into columns or sections. First identify what each heading says, then connect each displayed value only to the field beneath that heading. A familiar abbreviation can still mean something different across sources or periods, so use the chart’s own legend or notes wherever available.
Some Matka charts use terms such as open, close, jodi or panel. Their presentation and labels can vary. Do not assume that every chart includes all these fields or that a value in one format can be converted into another without a stated method. If a label is unexplained, record it as unclear rather than supplying a definition from memory.
Read the legend, symbols and abbreviations
A legend may explain letters, dashes, colour, punctuation or other marks. Read it before interpreting the body of the chart, and check whether it applies to the entire page or only a particular section. Small notes can qualify how entries appear.
If no legend exists, compare repeated labels cautiously. Repetition may suggest a consistent layout, but it does not confirm what an abbreviation means. Avoid expanding initials or symbols based only on another chart. When the chart leaves a mark unexplained, preserve the mark in your notes and identify it as unresolved.
Follow the sequence shown
Read across or down according to the chart’s own structure. A row may group information for one date, while columns may separate result categories. Yet a narrow screen, merged cells or a page break can disrupt that relationship.
Trace an entry from its date label to the relevant field heading before recording it. If lines, shading or borders are faint, zoom in or use a higher-quality copy. Do not read a value from a neighbouring row merely because the layout makes the intended connection appear likely.
Interpret One Entry Carefully
A reliable reading begins with one complete record, not with a scan of several values at once. Locate the date, confirm the row or block, identify the correct column, and then transcribe the value exactly as displayed. Include any symbol or qualifier that appears with it. This method reduces errors caused by shifting across a crowded table.
For example, in a hypothetical chart, a row might show a date at the left and several labelled fields to its right. A reader should match each value to its column heading, not assume that the first number belongs to a particular result type. The example describes a reading method and does not represent a real result.
Keep dates, rows and fields connected
When a chart spans several pages or screens, the column headings may not remain visible. Confirm them again after scrolling or turning a page. A repeated header may be absent, abbreviated or separated from the entries it labels.
If you copy a value into a separate note, copy its date and category at the same time. A number without those details can lose its meaning. Likewise, do not combine values from adjacent rows unless the chart explicitly groups them as one record. This is especially useful when a layout uses wrapped text or narrow columns.
Treat Older Layouts as Their Own Format
A chart’s presentation may change over time. Older pages may use different headings, spacing, abbreviations or grouping from a more recent layout. Even when two pages appear similar, they may not use identical conventions. A later format cannot automatically explain an earlier one.
Compare headings and legends across the relevant periods before combining records. Look for a clear note indicating a format change, or a point where the layout visibly shifts. If the chart does not explain the change, keep the periods separate in your working notes and describe the uncertainty. Do not silently standardise labels or recast values into a newer arrangement.
Preserve the original display
When organising historical information, retain a faithful transcription alongside any simplified version. Preserve the chart’s original label, spelling, punctuation and date format where practical. If you convert dates to a consistent format for sorting, keep enough detail to check them against the original.
This approach makes later review easier. It also prevents a cleaned-up table from appearing more certain than its source. If you add your own interpretation, separate it clearly from what the chart actually displays.
Handle Missing Dates and Unclear Entries
A gap deserves a note, not a guess. An absent date may result from incomplete coverage, a missing row, a page break, an unlabelled interval or another issue. Unless the source explains the gap, readers cannot safely choose among those possibilities.
Blank cells need similar care. A blank may mean that no value appears in that field, but it does not necessarily explain why. Do not replace it with zero, “no result” or another label unless the chart defines that convention. Use a neutral note such as “blank in source” when creating a reference copy.
Record corrections and repeated entries
Some charts may show revised, repeated or conflicting entries. Check for correction notes, visible edits, footnotes or a later version that clearly identifies itself as a replacement. Without an explanation, a repeated entry may reflect a duplicate, separate field, formatting choice or an unresolved inconsistency.
Do not select one version as correct just because it looks more plausible. Record both appearances, include their locations and flag the conflict. If the chart provides no reliable way to resolve it, keep the record marked as uncertain. A transparent uncertainty note is more useful than a confident but unsupported correction.
Mark uncertainty consistently
A simple notation can help readers separate clear entries from incomplete ones. For example, personal notes may distinguish “legible”, “partly legible” and “unclear”, provided those labels describe the transcription and do not alter the chart’s meaning.
Keep a note about why an entry is uncertain: faint print, missing heading, unclear date or conflicting display. This detail helps someone revisit the original later. Avoid adding a guessed value to make a table look complete.
Assess Whether the Chart Appears Complete
Completeness requires more than a long date range. Check whether the chart states its coverage, whether the displayed sequence follows that coverage, and whether the page or file appears to omit sections. A chart that begins and ends with dates may still have internal gaps.
Readers can review the following points:
- Does the heading identify the relevant category or market?
- Are the start and end dates visible?
- Do row labels follow an intelligible sequence?
- Are there blank or repeated entries that need explanation?
- Do the column headings and legend remain consistent?
- Does the page show signs of cropping, low resolution or missing sections?
These checks do not certify a chart as complete. They help describe what can and cannot be verified from its visible contents.
Check internal consistency without forcing it
Internal consistency means that the chart’s labels and layout appear to work in a stable way across the period being read. Compare repeated headings, date formats, row structures and field positions. Notice any sudden changes, but do not assume that every difference is an error.
A format may have changed intentionally, or the chart may combine separate sources. If the chart offers no explanation, document what changed and where. Do not alter an entry merely to make it fit a pattern. A careful record can include both a consistent portion and a section whose conventions remain uncertain.
Organise Entries for Reference
A clear working copy makes historical information easier to review. Choose fields that preserve context, such as the displayed date, chart category, original result label, value as printed and any note about uncertainty. Keep the original source location or page reference if available to you.
Sort entries only after confirming their dates. If a date lacks a year or uses an ambiguous format, do not place it into a precise timeline without qualification. Keep uncertain dates in a separate group or mark them clearly. Sorting can reveal missing stretches, but it cannot explain why they are missing.
Use a consistent transcription method
When copying entries, follow the same order each time. Record the date first, then the category and field, followed by the value and any note. Preserve leading zeroes or punctuation if they appear; changing a displayed value can change how another reader interprets it.
For a paper chart, a ruler or digital zoom can help keep the eye on the correct row. For a digital copy, check the full page rather than relying solely on a cropped image. If you use a spreadsheet or notes app, retain a column for comments so that uncertain interpretations do not blend into the transcription.
Common Reading Errors to Avoid
Many mistakes come from assigning a value to the wrong context. A reader may overlook a date boundary, treat a heading as a result, or move one cell too far while following a row. Slowing down at the point of transcription is often more effective than correcting a large batch later.
Watch for these errors:
- reading a value without checking the column heading;
- assuming a blank means a zero or a missing result;
- treating a repeated entry as a correction without evidence;
- overlooking a change in date format or layout;
- expanding an abbreviation without a chart-specific explanation;
- combining records from different categories or periods;
- treating an apparent sequence as proof of a rule.
A second check should compare the copied entry with its original location. Review the date and field as well as the value. This simple review can catch a misplaced row or transcription error.
Why Past Results Cannot Predict Future Results
A chart contains past entries. Even a long, orderly record cannot establish that a particular value will appear again, explain the process that produced it or show that one past entry caused another. A sequence that looks unusual may emerge from chance, incomplete records, selective attention or a format change.
Pattern analysis can describe what a reader sees in the available data, but description is not prediction. A run of repeated values does not prove that repetition will continue, and a long absence does not show that a value has become due. Historical records should remain historical records.
The same caution applies to summaries, counts and visual patterns. They can be affected by missing dates, unclear labels, duplicate entries or choices about which period to include. Unless the underlying process and data quality are established, a chart alone cannot support claims about future outcomes. Keep any observation limited to the records actually visible.
Questions to Ask Before Relying on a Chart
Before using an old chart as a historical reference, pause to assess its scope and readability. Ask whether the page names the category, states its date range and explains its result fields. Check whether the legend covers the entries in question and whether the layout stays consistent across the period.
Then consider the source and quality of the copy. Is the text legible? Are any dates cropped? Does a note explain blanks, revisions or a change in format? Can each value be traced to a row and field without relying on guesswork?
A useful review also asks what the chart cannot establish. Does it show only selected records? Are gaps unresolved? Are the labels ambiguous? Could another reader reproduce the same transcription from the displayed page? If several answers remain uncertain, describe the chart as an incomplete or unclear reference rather than treating it as a definitive record.
Conclusion
Read an old Matka chart by confirming its scope, date range, labels and layout before transcribing entries. Follow the chart’s own legend, preserve unclear details, and mark gaps or conflicts rather than filling them with assumptions. Check that each value stays connected to its date and field. Historical records can document what a chart displays, but they cannot establish a future result.
FAQs
1. What should I check first on an old Matka chart?
Start with the chart’s title, category or market label, date range and column headings. Then locate any legend or notes that explain symbols and abbreviations. These details establish what the chart appears to cover and how its entries are arranged. If the scope or labels remain unclear, note that uncertainty before transcribing values.
2. Can I assume every chart uses the same result labels?
No. Labels and conventions may vary by source, period or chart layout. Terms such as open, close, jodi or panel should be read in the context of the specific chart. Use its own headings and legend. If an abbreviation has no explanation, preserve it as shown rather than importing a definition from another chart.
3. What does a blank cell mean?
A blank cell only shows that no value appears in that position. Unless the chart explains its notation, the blank does not establish whether information was unavailable, omitted or intentionally left empty. Record it as blank in the source. Do not replace it with zero or a guessed status.
4. How can I avoid reading the wrong row?
Trace one entry at a time from its date to the relevant column heading, then copy the value with its date and category. Check whether the row continues across a page or screen break. Zoom in on faint borders, and compare the copied entry with its original position before relying on your notes.
5. How should I handle two different values for the same date?
Check for a correction note, separate field heading or later version that clearly explains the difference. If the chart does not resolve it, record both entries with their locations and mark the conflict. Do not choose one value based on which seems more plausible. Keep the uncertainty visible in any reference copy.
6. How can I tell whether a chart covers every date in its stated period?
Compare the first and last dates with the visible sequence between them. Look for absent rows, page breaks, cropped sections and changes in the date format. A chart may have gaps even when it states a date range. If it does not explain missing dates, record the gaps without assuming what they signify.
7. Should I convert older labels into a newer chart format?
Only if you can verify that both formats use the same definitions and fields. Similar appearances do not prove identical conventions. Preserve the original label and value, and keep any converted version separate with a note describing the method. If the relationship between formats cannot be confirmed, do not standardise the entry.
8. Is a repeated entry always a correction?
No. A repeated value may reflect a duplicate, separate category, formatting choice or an actual correction. Look for a note or layout feature that clarifies its purpose. Without that evidence, record the repetition as displayed and flag it for review. Do not silently remove one instance from your historical notes.
9. Can historical patterns show what a future result will be?
No. A chart records past entries; it does not establish that a future result will repeat, change or follow an apparent sequence. Patterns may also reflect gaps, unclear labels or selective coverage. Keep observations limited to what the chart shows, and do not treat them as reliable forecasts.
10. What details should I include in personal chart notes?
Record the displayed date, category, original field label and value. Add a note for blanks, unclear marks, conflicting entries or possible layout changes. Preserve the source location when available, and avoid adding an interpretation as if it were printed data. This keeps your notes traceable to the chart you checked.