
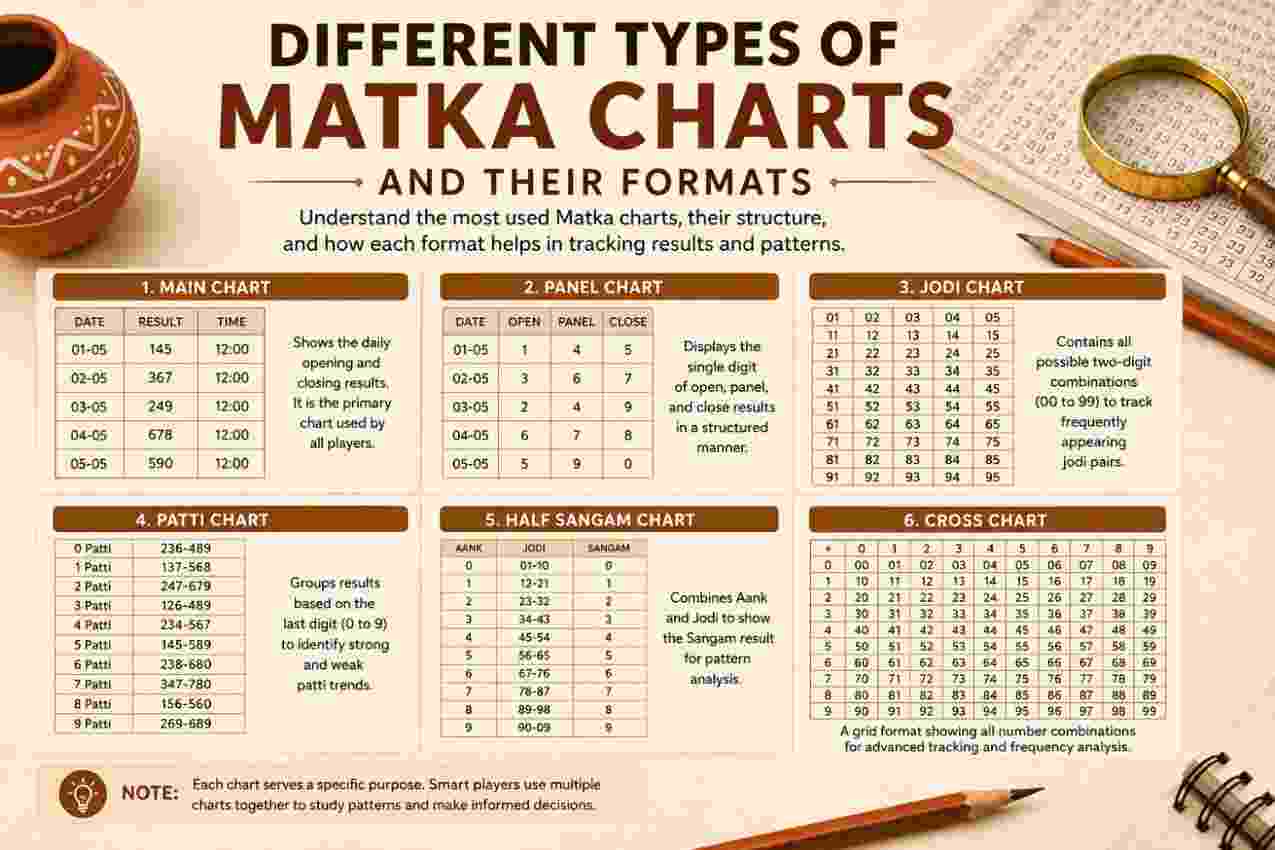
Matka charts organise published numerical records by date, category, market, and result stage. However, not every chart follows the same structure or serves the same purpose. Some display two-digit pairs, while others focus on three-digit panels, opening values, closing values, or complete result sequences. Historical charts may cover weeks, months, or years. Knowing the differences helps readers identify each field, verify calculations, preserve number order, and avoid confusing incomplete updates with final entries. Proper chart reading supports accurate record review without suggesting certainty about future outcomes.
Why Do Matka Charts Use Different Formats?
Different chart formats make large collections of numerical records easier to organise. A single layout cannot present every result component with equal clarity. Therefore, separate charts often focus on particular categories, periods, or result stages.
For example, a Jodi chart highlights two-digit pairs, whereas a panel chart displays three-digit combinations. Similarly, a daily chart may present one date in detail, while a yearly chart condenses many months into a broader historical record.
The main purposes of chart classification include:
- Separating number categories
- Arranging results chronologically
- Distinguishing opening and closing values
- Preserving market-specific records
- Supporting quick historical comparisons
- Showing complete and incomplete entries clearly
- Reducing mistakes during data transcription
Dpboss Matka records may combine several chart styles depending on how much information the layout needs to display. Consequently, readers should check the title, date range, column labels, and number format before interpreting any entry.
A chart should function as an organised record, not as evidence of a certain future result. Although archived information can reveal repetition, it only describes previous outcomes.
Single-Digit Charts
Single-digit charts focus on values ranging from 0 to 9. These digits usually come from the final digit of a three-number panel total. Because the category contains only ten possible values, the layout often appears simple and compact.
How Single Digits Form
A three-digit panel produces a single value through addition. For example:
1 + 3 + 7 = 11
The chart retains the final digit of the total, which is 1. Therefore, panel 137 connects with the single digit 1.
Another panel may produce zero:
2 + 3 + 5 = 10
In this case, the linked single digit is 0. Zero represents a valid recorded value rather than a blank field.
Open and Close Single Charts
Some single-digit charts separate opening values from closing values. The open single comes from the opening panel, while the close single comes from the closing panel.
A chart may display these values in different columns:
- Date
- Open single
- Close single
- Status or completion marker
Consequently, readers must preserve the position of each digit. An opening value of 2 followed by a closing value of 8 creates a different result from an opening value of 8 followed by a closing value of 2.
Uses of Single-Digit Records
Single-digit layouts help readers check panel calculations and confirm the digits that form a Jodi. Moreover, they provide a compact view when full panel details are unnecessary.
However, a single-digit chart does not always display the original three-digit panels. Readers who need complete result verification should consult a format containing both panels and the central pair.
Jodi Charts
A Jodi chart records two-digit pairs from 00 through 99. The first position represents the opening single, whereas the second represents the closing single. As a result, the pair connects both stages of a completed entry.
Structure of a Jodi Chart
Most Jodi charts arrange results by date. Depending on the selected period, rows may represent days and columns may represent weeks or months.
Common fields include:
- Result date
- Day of the week
- Two-digit Jodi
- Market or category heading
- Blank or unavailable entry marker
For instance, a pair displayed as 04 must retain its leading zero. Writing it as 4 removes the opening position and changes the established two-digit format.
Double Jodi Charts
A double Jodi contains two identical digits, such as:
- 00
- 11
- 22
- 33
- 44
- 55
- 66
- 77
- 88
- 99
Some charts group these pairs for classification or historical comparison. Nevertheless, a double pair remains part of the standard Jodi range. Its repeated structure does not provide special certainty about later outcomes.
Mirror and Reverse Pair Records
A reversed pair uses the same digits in opposite positions. Examples include 14 and 41, 27 and 72, or 09 and 90.
Although such pairs look connected visually, each represents a separate result. Therefore, charts must preserve the original order. Treating reversed pairs as interchangeable can distort frequency counts and historical comparisons.
Weekly Jodi Charts
Weekly formats group pairs into seven-day periods or according to the operating schedule represented in the record. They allow readers to compare daily entries without scanning an extensive annual layout.
Additionally, weekly charts make blank dates easier to identify. A missing value may indicate a closure, an unpublished result, or incomplete data rather than the number zero.
Panel or Panna Charts
Panel charts display three-digit combinations. These combinations may represent opening panels, closing panels, or both. Since panels contain more detail than singles or Jodis, their layouts usually require wider columns.
Opening Panel Charts
An opening panel chart records the first three-digit value in a result sequence. The sum of its digits produces the opening single.
Consider panel 246:
2 + 4 + 6 = 12
Therefore, the open single is 2.
An opening panel chart may also include the calculated single in an adjacent column. Consequently, readers can verify the arithmetic without switching between separate records.
Closing Panel Charts
A closing panel chart focuses on the final three-digit value. Its digit total produces the closing single, which occupies the second position in the Jodi.
For panel 569:
5 + 6 + 9 = 20
The associated close single is 0.
Because opening and closing panels serve different positions, charts should label them clearly. Otherwise, readers may reverse the complete sequence during transcription.
Combined Panel Charts
Combined layouts display both three-digit panels, usually with the Jodi placed between them. A full entry may appear as:
246-22-345
Panel 246 totals 12, producing the opening digit 2. Similarly, panel 345 totals 12, producing the closing digit 2. The central Jodi is consequently 22.
These charts offer the strongest format for arithmetic verification because every connected value appears in one line.
Single, Double, and Triple Panna Charts
Panna charts may classify panels according to repeated digits. This structural grouping helps readers sort large record collections consistently.
Single Panna Charts
A single Panna contains three different digits. Examples include 123, 145, 260, 379, and 458.
The chart may arrange these combinations according to their linked single digit or recorded date. Moreover, some layouts place all panels producing the same final digit within one category.
Although the name includes “single,” it describes a three-digit panel with no repetition. It does not refer to the separate single-digit result category.
Double Panna Charts
A double Panna contains two matching digits and one different digit. Examples include 112, 229, 334, 557, and 899.
The linked single still comes from the complete digit total. For example:
2 + 2 + 9 = 13
Therefore, panel 229 connects with single digit 3.
A double Panna chart may group panels by repeated digit, final total, or associated single value. Readers should check the category labels before comparing entries.
Triple Panna Charts
A triple Panna repeats the same digit three times. Typical entries include 111, 222, 333, 444, and 999.
For example:
7 + 7 + 7 = 21
Thus, panel 777 produces a single-digit 1.
Triple Panna charts contain fewer structural combinations than single or double Panna formats. However, historical appearances remain recorded outcomes rather than reliable indicators of later results.
Full Result Charts
A full result chart brings the main number categories together. It normally displays an opening panel, a Jodi, and a closing panel in one complete sequence.
Standard Full Result Layout
A standard entry may look like:
137-10-569
Its components include:
- Opening panel: 137
- Opening single: 1
- Jodi: 10
- Closing single: 0
- Closing panel: 569
The calculation confirms the relationship. Panel 137 totals 11, so the open single is 1. Meanwhile, panel 569 totals 20, so the close single is 0.
Full result charts offer more context than category-specific formats. Additionally, they make copying and checking records easier because readers can see every connected value together.
Expanded Full Result Layout
Some charts separate each component into an individual column instead of using a hyphenated sequence. An expanded row may contain the date, opening panel, open single, Jodi, close single, and closing panel.
This format improves sorting and spreadsheet entry. In contrast, compact sequences save space but require readers to recognise each position accurately.
Incomplete Full Result Entries
A result may remain incomplete while the closing stage awaits publication. In such cases, the chart may display an opening panel and open single while leaving later fields blank.
Dashes, asterisks, or empty cells usually indicate unavailable information. They should not automatically become zero because zero represents an actual numerical result.
Open-to-Close Charts
Open-to-close charts emphasise how the first stage connects with the second stage. They may show singles, panels, or complete sequences, depending on the available data.
Separate Stage Presentation
Some layouts publish opening information in one section and closing information in another. This division can help readers track when each value appeared.
However, separate sections require careful date matching. An opening result from one row should never connect with a closing result from another date.
Side-by-Side Presentation
Side-by-side charts place opening and closing information within the same row. This structure reduces positional confusion and makes missing values more visible.
Typical columns may include:
- Date
- Opening panel
- Open single
- Close single
- Closing panel
- Completion status
Therefore, readers can verify each side before interpreting the central pair.
Daily Result Charts
Daily charts present records for a single date or a short sequence of dates. They often include several scheduled categories within one layout.
Features of Daily Charts
A daily chart may display:
- Market or category name
- Opening time
- Closing time
- Opening panel
- Jodi
- Closing panel
- Publication status
Because the chart focuses on a narrow period, it can provide more detail than a monthly or yearly record. Meanwhile, its limited scope makes long-term comparison less convenient.
Reading Daily Updates Carefully
Readers should distinguish completed results from partial updates. A visible opening panel does not mean the closing section has appeared.
Additionally, publication times and result times may differ. Therefore, the date, status, and completed numerical sequence offer more reliable classification than assumptions based only on timing.
Weekly Matka Charts
Weekly charts group several consecutive daily records into one section. They balance detail with convenient comparison and often form the building blocks of monthly archives.
Common Weekly Layouts
Rows may represent separate dates, while columns display number components. Alternatively, each row may represent a category, with individual days arranged across columns.
Both formats can work effectively. However, readers should identify the orientation before copying values.
Weekly charts help with:
- Checking missing dates
- Comparing daily Jodis
- Reviewing complete sequences
- Separating active and closed days
- Identifying transcription gaps
- Organising records for monthly storage
Repeated values may appear within the same week. Nevertheless, repetition shows only what the archive contains and cannot establish a subsequent outcome.
Monthly Matka Charts
Monthly charts collect several weeks of results under one month and year. They provide a broader view while retaining enough date detail for individual entry checks.
Calendar-Style Monthly Charts
A calendar-style format positions results according to dates or weekdays. This arrangement makes chronological movement easy to follow.
However, months begin and end on different weekdays. As a result, blank spaces may represent calendar alignment rather than missing results. Readers should check actual date labels before treating an empty cell as an omission.
List-Style Monthly Charts
List-style formats use one row per date. They may include the complete result or only a selected category, such as the Jodi.
This design supports straightforward copying and filtering. Moreover, chronological rows make duplicate dates and missing entries easier to notice.
Cross-Month Boundaries
Weekly periods sometimes cross from one month into another. A reliable chart should assign each entry to its actual date rather than grouping it solely by the week’s starting point.
Consequently, readers comparing monthly totals should verify boundary dates carefully.
Yearly and Historical Charts
Yearly charts arrange many months of archived records within one structured view. Historical charts may extend across several years, providing a long-range collection of past results.
Yearly Jodi Charts
A yearly Jodi chart commonly places dates or weekdays in rows and months in columns. Because it compresses substantial information, it may omit panels and show only two-digit pairs.
This format suits broad comparisons. In contrast, readers seeking panel-level verification will need a more detailed chart.
Yearly Panel Charts
Yearly panel records require additional space because each result may contain two three-digit values. Therefore, these charts often divide the year into months or shorter blocks.
Clear month and date headings remain essential. Without them, visually similar panels can easily shift into the wrong period during transcription.
Multi-Year Historical Charts
Multi-year charts support archival review across longer periods. They may group records by year, market category, or number type.
Before making comparisons, readers should check whether every year follows the same schedule and formatting. Changes in operating days, missing archives, or revised layouts can create misleading frequency differences.
Market-Specific Charts
A market-specific chart stores records connected with one named result category or schedule. Separating these records prevents numbers from different sources or time slots from mixing.
Why Separate Market Charts Matter
Two categories may publish different results on the same date. Therefore, the date alone cannot identify the correct entry.
Readers should verify:
- Exact chart heading
- Relevant date
- Opening and closing schedule
- Number format
- Completion status
- Historical period
Dpboss Matka archives may contain many similarly formatted chart sections. Consequently, copying the heading with the data helps preserve proper context.
Combined Market Charts
A combined chart places several categories within one page or layout. It offers convenient access but increases the risk of reading across the wrong row.
Strong visual separation, consistent labels, and distinct date fields make combined records safer to use. Even so, readers should check the heading before every transcription session.
Category and Digit-Family Charts
Some charts group numbers by shared numerical properties rather than publication date. These specialised formats support classification and record sorting.
Digit-Family Charts
A digit-family chart may group panels that produce the same final single. For example, several different panels can total a number ending in 4.
This arrangement demonstrates mathematical relationships between panels and singles. However, it does not show when each panel appeared unless the chart also includes dates.
Pair-Family Charts
Pair-family formats may group Jodis by opening digit, closing digit, repeated digits, or reversed structure.
For example, a chart could collect all Jodis beginning with 3:
- 30
- 31
- 32
- 33
- 34
- 35
- 36
- 37
- 38
- 39
Such classification supports organised reference. Nevertheless, it should remain separate from claims about future probability.
Panel-Sum Charts
Panel-sum charts connect three-digit combinations with the final digit produced by their totals. They allow readers to verify which single belongs to a given panel.
Additionally, these charts can reveal data-entry errors when a displayed single conflicts with the calculated total.
How to Read Any Matka Chart Accurately
Different formats require slightly different reading methods, but a consistent review process reduces mistakes.
- Read the chart heading and identify its category.
- Confirm the covered date, month, or year.
- Check whether the layout shows singles, Jodis, panels, or full results.
- Identify the direction of rows and columns.
- Preserve leading zeros in two-digit pairs.
- Keep opening and closing positions in their original order.
- Treat blanks and placeholders as unavailable information.
- Verify panel totals when full results appear.
- Record incomplete entries separately.
- Avoid treating historical repetition as certainty.
Moreover, consistent formatting matters when transferring entries into notes or spreadsheets. Dates should follow one style, pairs should retain two digits, and panels should retain all three positions.
Common Mistakes Across Chart Types
Most chart errors come from misreading structure rather than difficult calculations.
Using the Wrong Date Intersection
Calendar and grid layouts require precise row-and-column matching. Reading one cell above or below the correct intersection can attach a valid number to the wrong date.
Dropping Zeroes
Pairs such as 01, 05, and 09 require two digits. Similarly, zero can appear as a legitimate open or close single.
Mixing Different Categories
A Jodi should not be recorded as a panel, and an opening panel should not replace a complete result. Therefore, category labels must remain attached to copied data.
Assuming Every Blank Means Missing Data
Some blanks provide calendar spacing, while others indicate closed days or incomplete records. Context determines their meaning.
Using Archives as Predictions
Charts document previous outcomes. Consequently, frequency, repetition, mirrored pairs, and recurring panels cannot prove what will happen later.
Conclusion
Different Matka charts organise numerical records according to category, period, position, and level of detail. Single-digit, Jodi, panel, full-result, daily, monthly, yearly, and specialised charts each serve a distinct archival purpose. Careful readers should confirm headings, dates, number order, leading zeros, and completion status before recording an entry. Dpboss Matka chart formats become easier to interpret when every value remains connected with its proper context. Although historical layouts support accurate comparison, they record previous outcomes only and cannot confirm future results.
FAQs
What are the most common types of Matka charts?
Common formats include single-digit, Jodi, panel, Panna, daily, weekly, monthly, yearly, full-result, and market-specific charts. Each layout organises a different part of the record. Some focus on number structure, while others arrange complete outcomes according to dates or longer historical periods.
How does a Jodi chart differ from a panel chart?
A Jodi chart displays two-digit pairs from 00 to 99. In contrast, a panel chart contains three-digit values connected with opening or closing stages. Panel totals produce single digits, and two singles combine to create the Jodi shown in a completed result.
Why do some charts contain blank cells or symbols?
Blank cells can represent calendar spacing, closed schedules, unpublished results, or incomplete updates. Dashes and asterisks may serve as placeholders. Readers should inspect the date, chart format, and completion status before assigning meaning. A blank field should never become zero without explicit numerical confirmation.
Which chart offers the most result detail?
A full result chart generally provides the most detail because it includes the opening panel, central Jodi, and closing panel. Expanded versions may also show separate opening and closing singles. This structure allows readers to verify panel calculations and confirm whether all connected values form a consistent sequence.
Can historical Matka charts confirm future numbers?
No. Historical charts provide organised records of earlier outcomes, but they cannot establish a certain later result. Repeated Jodis, matching panels, digit families, or frequency patterns may support archival classification. However, each observation remains historical data and should not become a claim of prediction or certainty.